SERP View Help Guide
Viewing the Top 20, 30, 50, or 100 results is now easier than ever with this guide. Learn more: SERP View
The Problem
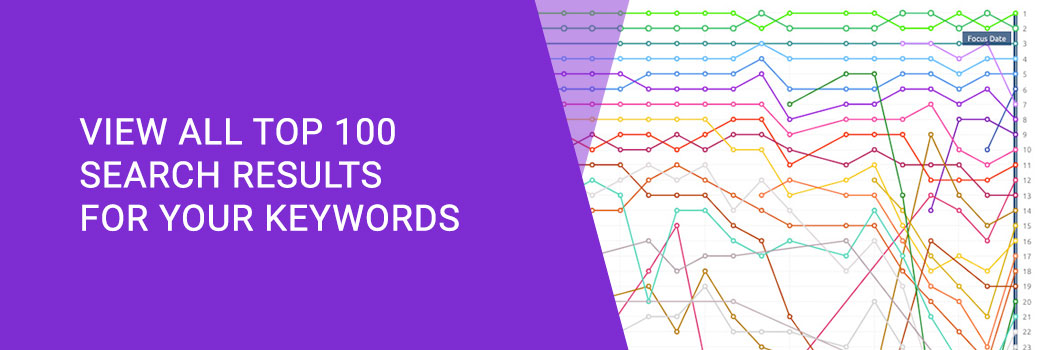
When doing SEO we needed a way to view the competition: who was ahead, who was new to the SERPs (overnight skyrocketed), and who was dropping. With traditional rank trackers there was no way to visualize this unless you monitored each competitor you found.
Even then you would have to manually Google each keyword search term to find new competitors.
AND what if you did find someone brand new, how long had they been there?
Are they a one-hit wonder or have they been crawling up the SERPs for months?
Our Solution
The simple solution was to simply monitor all the results for the top 20, 30, and 100 for each keyword. Then store that data and connect the dots of their rankings.
Example: When a competitor suddenly drops we can visually see this data.
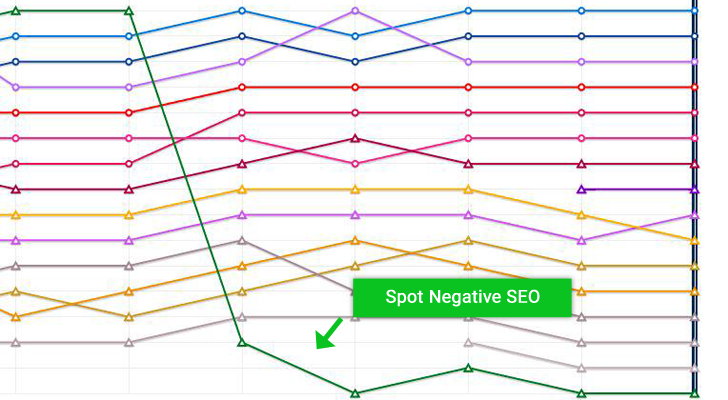
Now with visualization of the search results for each keyword, which no other rank tracker had allowed before, SERPWoo was born.
Secret Sauce Usage:
1. When viewing the full SERPs of a keyword, use the Tagging feature to monitor competitors, faste movers. By tagging competitors you will start collecting additional details of where they rank within all the keywords of your project.
Get Started
Here is a quick overview of the keyword dashboard.
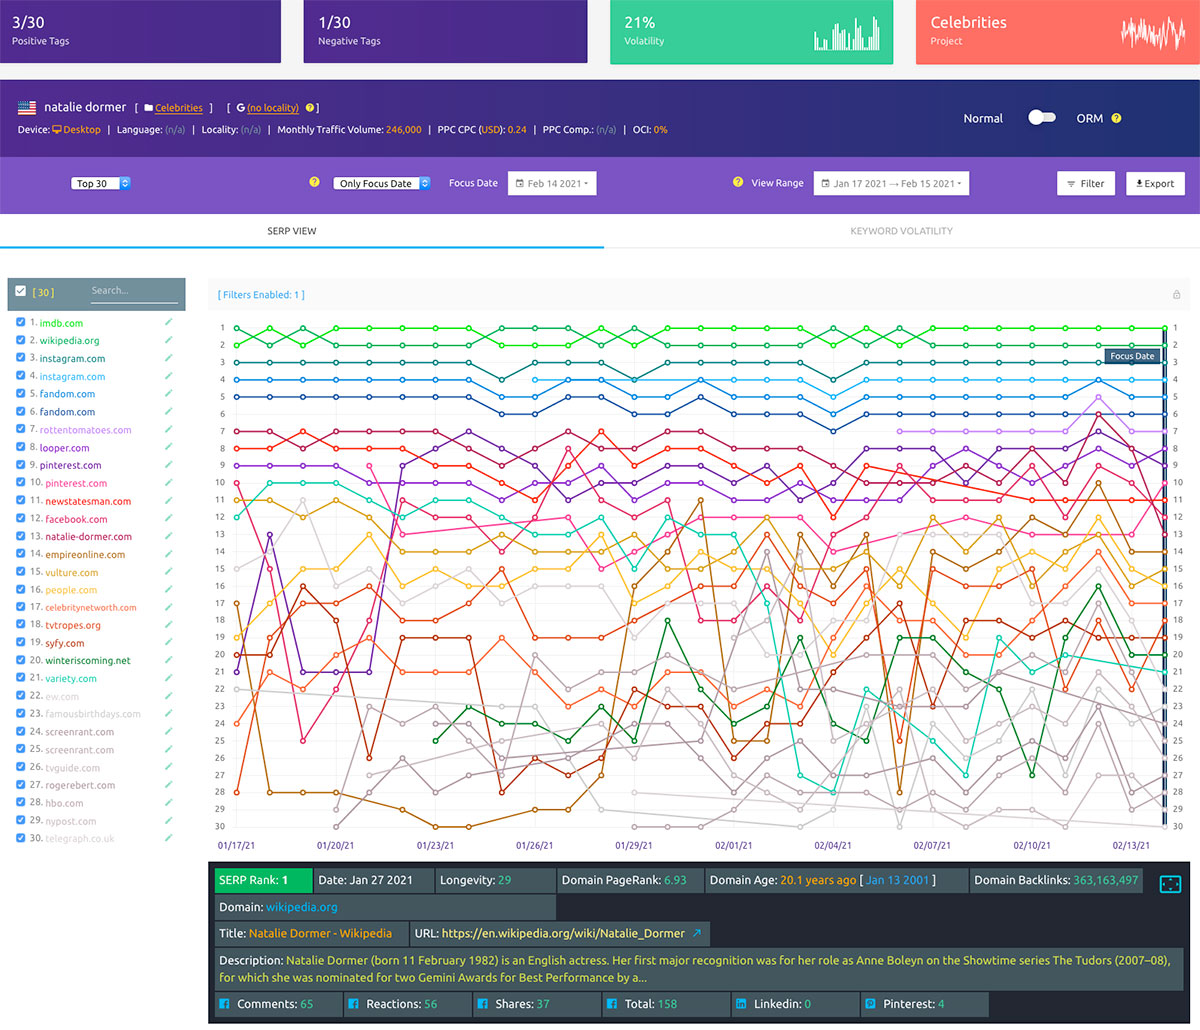
Mini-Charts
The top mini-charts are a quick overview of your data.

The 1st mini-chart displays your current domains/urls' (positive tags) current movement within this particular keywords' SERP (this can be click to quickly switch Main Chart to ORM Goggle Mode).
The 2nd mini-chart displays domains/urls you have tagged negative's current movement (this can be click to quickly switch Main Chart to ORM Goggle Mode).
The 3rd mini-chart displays the volatility ( ) of this keyword, clicking on this will reveal a closer inspection of this keyword's volatility.

The 4th mini-chart showcases this keyword's project's overall movement as a sparkline( ). Click on the mini-chart to showcase the Quick Insight Data ( ) for this project. This helps you compare how this keyword is doing for your domains versus the overall other keywords within this particular project.
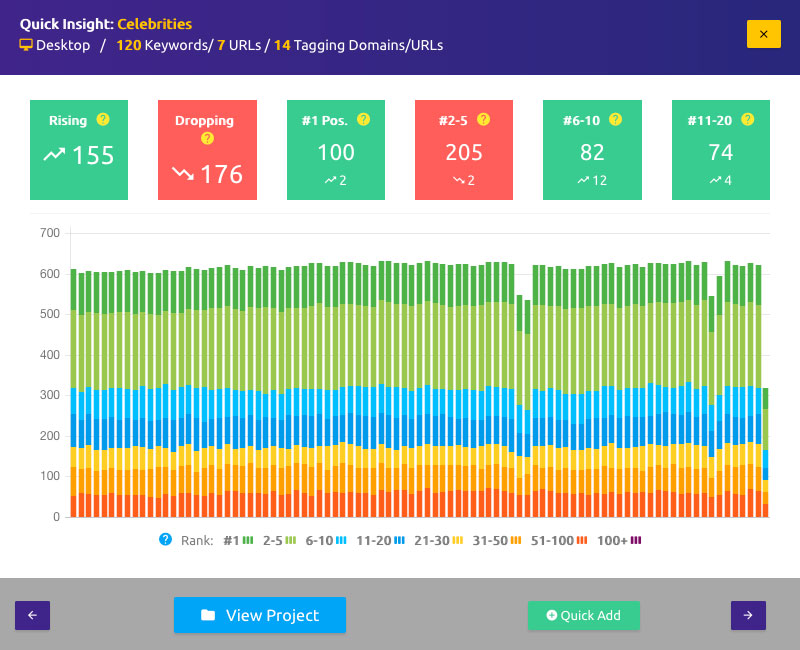
Legend
The legend on the left-hand side of the dashboard corresponds with the SERP ranking (in most cases).

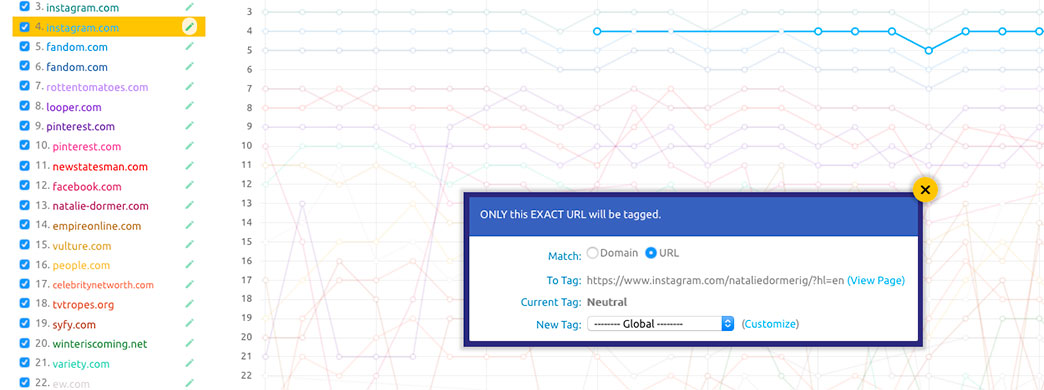
You can click on the edit icon next to a domain/url and change it's ORM (online reputation management) tag.
You can tag competitors URLs or whole domains (which saves the tag within this particular project). You can tag domains negative (ORM problems), positive, or neutral - o or customize them.
SERP View Info & Control Section

Underneath the keyword you'll see several pieces of data.
The 1st data set indicates whether this keyword is being tracked for Desktop or Mobile results.
The 2nd data set indicates whether this keyword has a language set.
The 3rd data set indicates whether this keyword has a locality set.
The 4th data set indicates the monthly traffic volume for this keyword.
The 5th data set indicates the CPC (Cost Per Click) (In PPC = Google Adwords) an advertisers is expected to pay for bidding on this keyword.
The 6th data set indicates the PPC Comp (Pay Per Click competition). 0 = no competition and 50% means 50% of the ADs are being bidded on. 100% means ALL potential ADs are being bidded on.
The 7th data set indicates the OCI (Online Commercial Intent) of this keyword. This indicates the level of intent that users have when using this search keyword. Commercial Intent indicates the potential competitor level within organic search results and paid section for this keyword's results.

If a keyword has a location setting, due to the project being created with a location setting you will see a "Live Results" link.
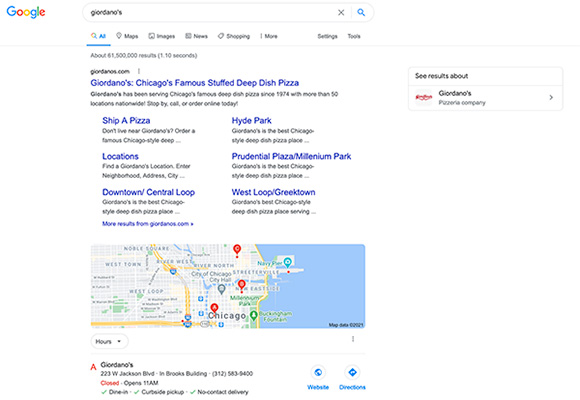
The results in the screenshot are for the keyword "Giordanos" as if we are standing in "Chicago, Illinois, USA".
You can get as accurate as postal code as well.
Learn more about: Local SEO Rank Tracking
SERP View Control
Within this below section you can control the SERP View data you see.

SERP Positions
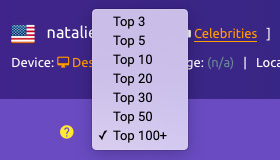
The first dropdown option allows you to select the amount of ranking positions you want to display.
Focus Date
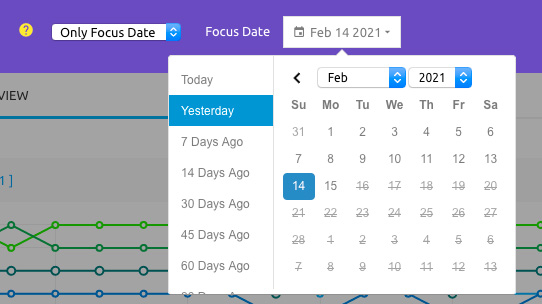
The next option is the Focus Date.
Since domains and URLs jump in and out of the SERPs we created the Focus Date to organize what you see.
The Focus Date's SERP order of top 1-20 (or whatever you selected) corresponds to the Legend's 1-20 positions. So #1 would be the first position within the result pages of this keyword, and #2 would be the second result and so on. SiteLinks, Maps, and Rich Data are counted as positions (there are options to remove them in the Filter section).
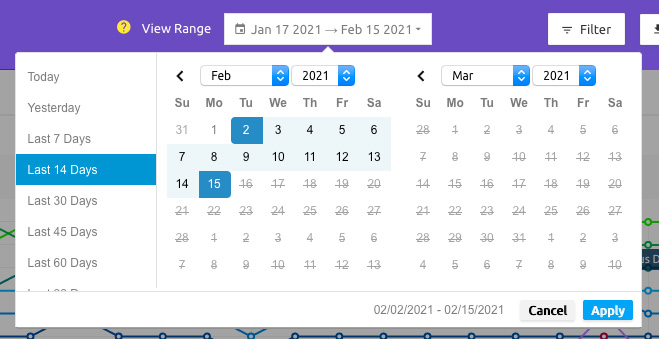
View Range
The next option is your View Ranges.
This is the timeframe you want to view within the SERP View chart. This defaults to the last 14 days of data.
What would I use this for?
Changing the focus date and view ranges allows you to go back to days in the past for your data and check for the rankings on that day, and watch which domains continued ranking within the selected view range.
This helps you watch competitors and find out which competitors are worth studying versus ones that are weak and no longer ranking. You can watch which URLs have been ranking the longest and then click on the various outbound links to 3rd party platforms to continue studying their SEO campaign.
You don't have to bother with URLs which are here for a day or two then get immediately removed from the SERPs, you can now just concentrate on the truly strong competitors. Here is an example:
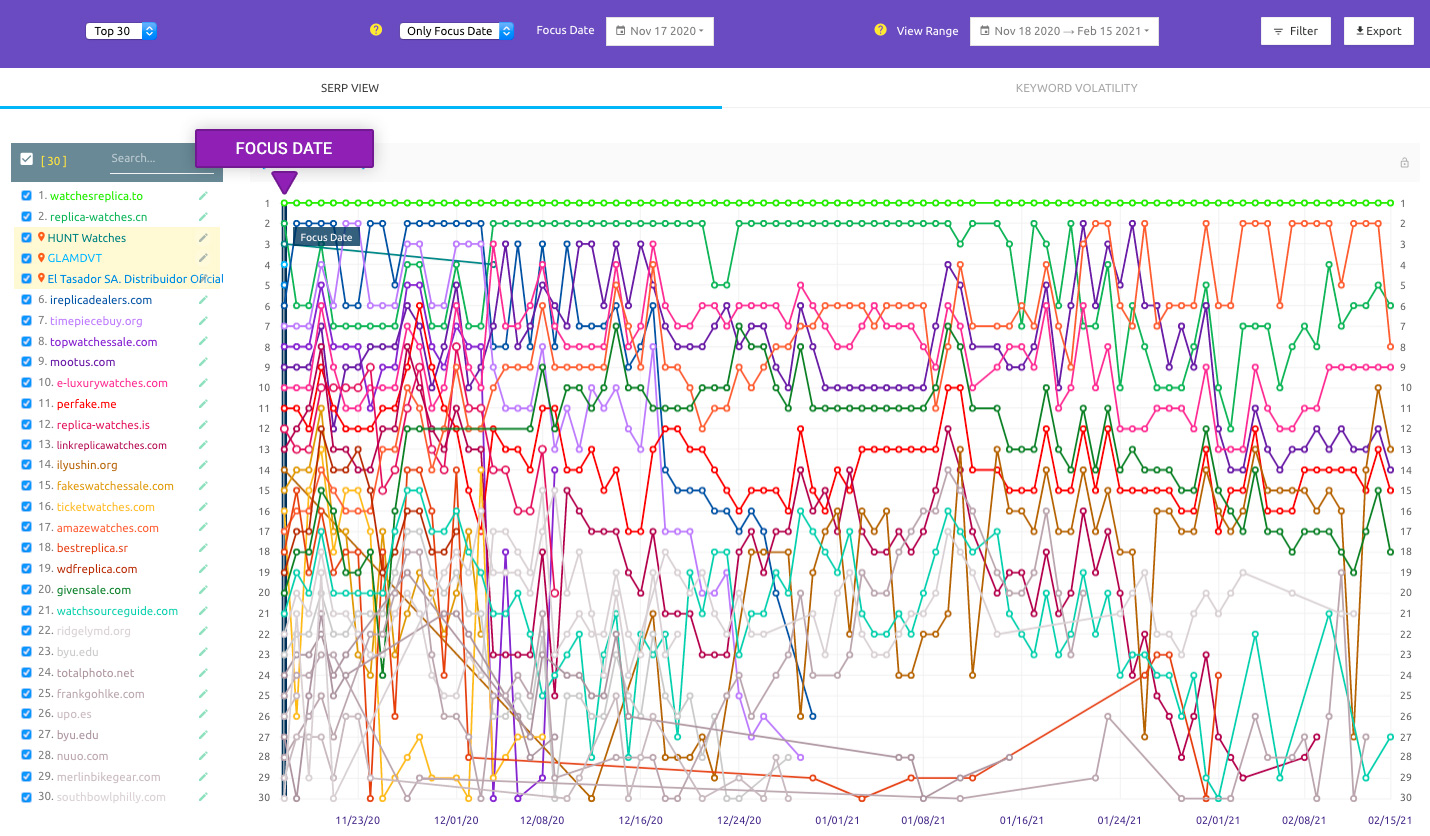
^^ In the above example I changed the Focus Date to a date in the past and noticed that out of the top 20 urls ranking on that date (August 1st 2015), only 5 of them made it to March 14th 2016. Now I can focus in on the winners of a niche and disregard the losers.
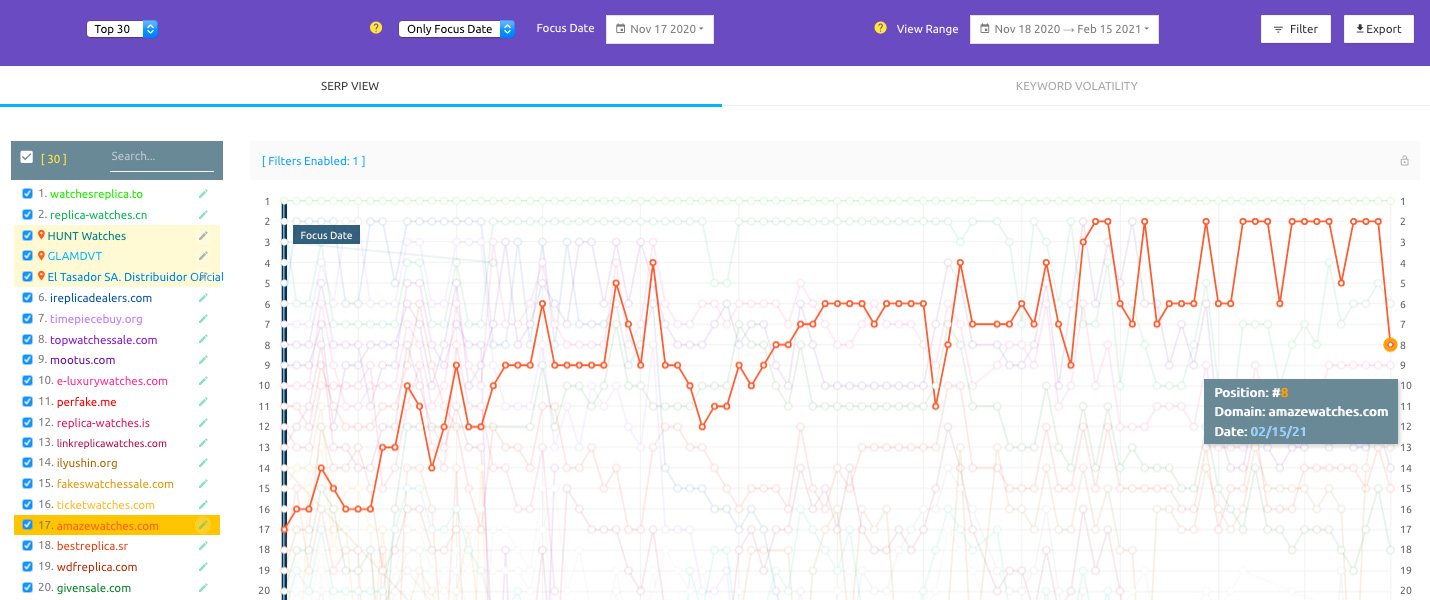
^^ If you look a bit closer you can see this particular url has a wild ride and was able to start ranking on August 1st, then dropped, then somehow turn it all around. What did they do? That's where the 3rd party platforms allow us to go deeper into their rankings.
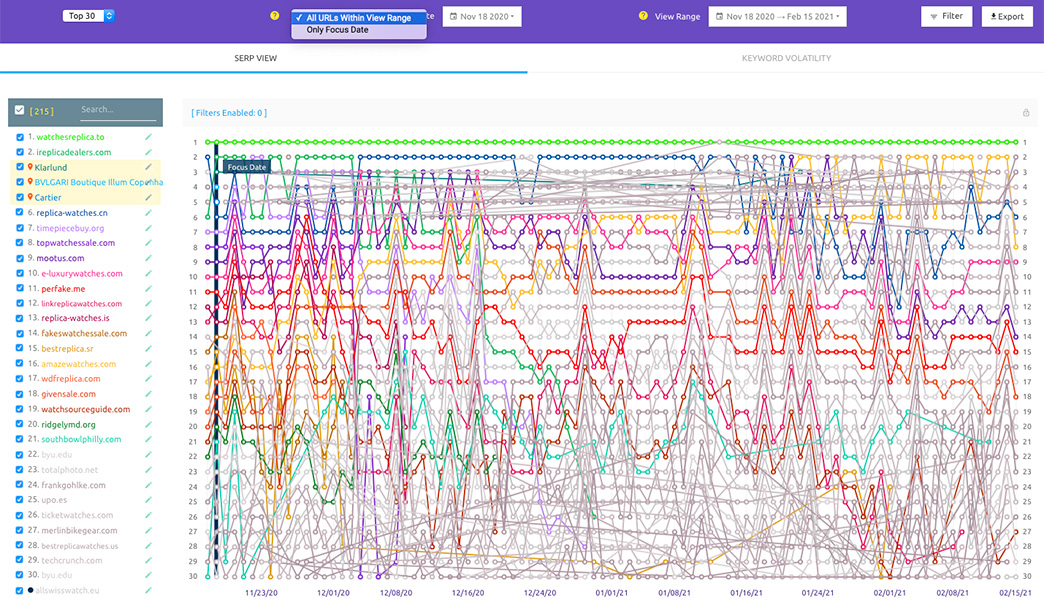
ORM Google Mode

One of the great things about the SERP View is it allows you to visually see the positive and negative aspects of your search results. Select "ORM" and the color scheme changes to the sentiment values.
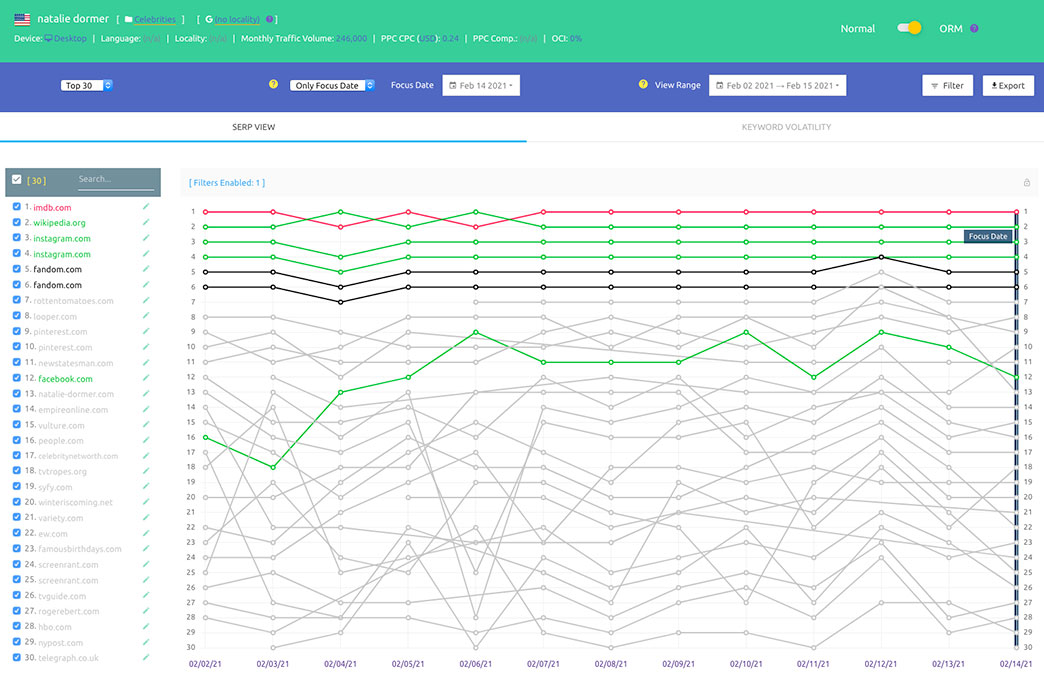
Filter
The next option is your filter.

Here you can remove Sitelinks / Maps / Special Data as well adjust other displays.
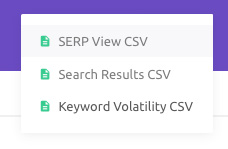
The next option is your Export option.
You can export different aspect of your data for your own usage.
Data Window
You may notice when you hover over a domain/url within the Main Chart there is a data window that showcases that individual url's data. You can expand that window by clicking on the top right expand icon within and it will stay on your screen throughout your research.

Several of the metrics are clickable and will take you to the respective 3rd party platform's output to help you get your research done quicker.
Search Engine Results Data
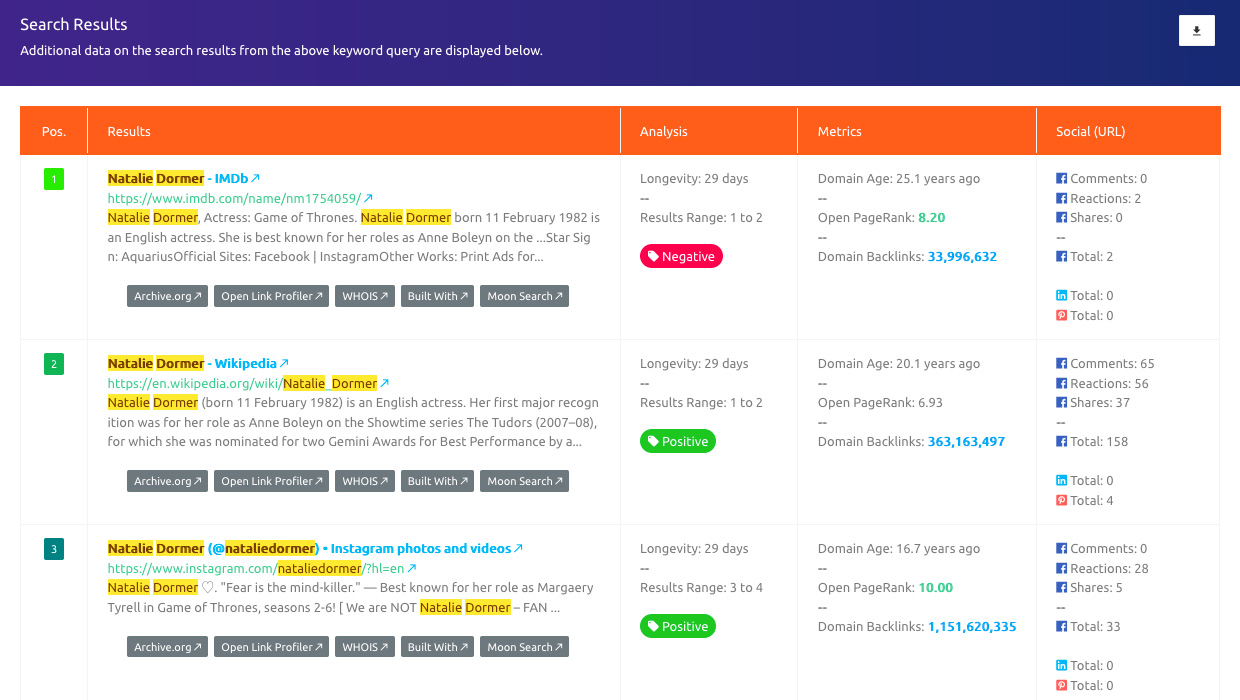
Here we have an organized table of the SERP data we've collected. We continuously collect and update the data/metrics within the top 20 and top 30 URLs. (We do not collect data on URLs that have not entered the top 20/30 for a given keyword at least once during the time period since we started monitoring the keyword).
Several additional metrics are implemented to give you a deeper understanding of what domains/URLs are ranking within each keyword's search results.
Get in touch or create an account.